What the Indicators Are Indicating
There is a high probability of a turning point.
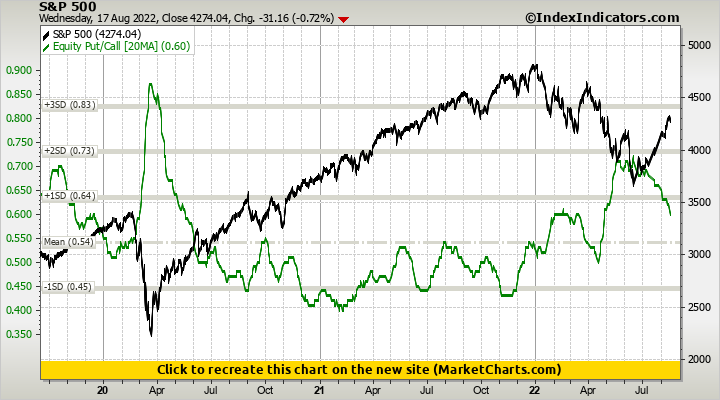
- The CBOE 10 day average equity put call ratio is now 1 standard deviation below the mean for the past three years, a level always associated with tops.
- The CBOE 20 day average equity put call ratio is below the level (i.e. higher levels of call buying) than in October 2007 (which was a major market top)
- In late August, the AAII sentiment survey showed high levels (50%!) of bearish sentiment. This quickly reversed, and the past several weeks has shown very strong bullish sentiment. In fact, the two most recent episodes of such sustained bullish sentiment were May 2008 (!) and October 2007 (!!). These AAII survey participants are true retail rubes - always bearish at bottoms and bullish at tops. They are a great fade.
- Over the past week, corporate insiders have sold 1,411x as much stock (in market value) as they purchased. Unlike the AAII survey participants, the corporate insiders have a good sense of the true worth of their companies' stock, and they are bullish at bottoms and bearish at tops. And, notice some of the big insider sellers: Oracle, Tiffany, Amazon, Salesforce, Apple - the NASDAQ overvalued momentum names.
- The breadth indicators (stocks above 20 day average, stocks above 50 day average) hit levels that are typically associated with corrections.
![]()


No comments:
Post a Comment