Showing posts with label X. Show all posts

Thursday, November 2, 2023

Coal & Steel Producer Earnings - Q3 2023 ($BTU $ARCH $AMR $HCC $X)

[Previously: Coal Earnings (Q2 2023), Coal Producer Earnings for Q1 2023, Warrior Met Coal, Peabody Energy.]

Peabody Energy
The market capitalization of Peabody (BTU, 10-Q) is now $3.3 billion versus $2.8 billion when we wrote about them last quarter. (It was $4 billion when we wrote about them in August 2022.) Total liabilities less current assets are now $276 million, and current assets exceed current liabilities plus long term debt by almost a billion dollars.

We would put the enterprise value at $3.6 billion now. For the third quarter of 2023, adjusted EBITDA was $270 million, down from $358 million in the second quarter. That puts the EV/EBITDA at 3.3x using this quarter or 2.7x based on the first nine months of this year.

During the third quarter, Peabody's seaborne thermal coal sold for $71 per ton with a $44 cost per ton; seaborne met coal for $160 per ton with a $110 cost per ton; PRB coal for $14 per ton with an $11 cost per ton; and other U.S. thermal coal for $54 per ton with a $42 cost per ton. Once again, seaborne thermal coal was the most profitable segment in Q3, earning $116 million of adjusted EBITDA, with seaborne met right behind, earning $79 million in adjusted EBITDA. The U.S. thermal coal (PRB & other) together earned $103 million of EBITDA for the quarter.

Peabody's "Available Free Cash Flow" (AFCF) for the first nine months of the year has been $648 million. From the start of 2023 through October 20, 2023, the Company has returned $307.4 million to shareholders, including a fixed dividend of $20.7 million and share repurchases of $286.7 million. The Company has repurchased 13.4 million shares, or 9.3% of shares outstanding.

Notice that the EBITDA/EV yield of Peabody is now pretty similar to Natural Resource Partners, but practically all of NRP's EBITDA is free cash flow and is available for distribution to shareholders, while Peabody has spent about $200 million on capital expenditures so far this year. Also, as a royalty owner, NRP's cost of production is zero, while Peabody's operating costs and expenses are two-thirds of total revenue.

Arch Resources
The market capitalization of Arch Resources (ARCH, 10-Q) is $2.8 billion versus $2.5 billion last quarter. Their total liabilities less current assets are now $164 million, and current assets exceed current liabilities plus long term debt by several hundred million dollars. We would put the enterprise value at $3 billion now. 

For the third quarter of 2023, adjusted EBITDA was $126 million, down from $130 million in the second quarter. That puts the EV/EBITDA at 6x using this quarter's results.

They sold 2.3 million tons of met coal (versus 2.5 million the prior quarter) and 16.8 million tons of thermal coal (versus 16.3 million) this quarter. The price of met coal was slightly higher but the net effect with the lower production quantities was that EBITDA was down slightly.

Arch reported "discretionary cash flow" of $87 million for the quarter, which was the difference between their cash from operations of $131 million and $44 million of capital expenditures. They returned $100 million to shareholders via a dividend of $72 million and $28 million spent repurchasing stock.

AMR
Alpha Metallurgical Resources (AMR) is the largest U.S. met coal producer, representing about one-fifth of total U.S. production. According to their recent investor presentation, between two-thirds and three-quarter's of AMR's met coal is exported, with India accounting for a third of their export sales over the past five years.

The market capitalization of AMR is $3 billion, up from $2.6 billion last quarter. AMR stock has really been on a tear since they are allocating lots of cash to share repurchases. Their current assets less total liabilities (ignoring deferred taxes) are now $289 million, so we would put the enterprise value at $2.7 billion.

For the third quarter of 2023 (release, 10-Q), AMR's adjusted EBITDA was $154 million, down from $259 million in the second quarter. That puts the EV/EBITDA at 4.4x using this quarter or 2.6x based on the first nine months of this year.

They sold 4.1 million tons of met coal in Q3, the same as in Q2. They got $155/t for met coal versus $173/t the previous quarter. Their cost of met coal sales was up slightly to $110 per ton from $106 per ton the prior quarter.

AMR has said that they are going to cease paying a dividend after the fourth quarter and focus their cash on share repurchases:

Following the dividend payment for this quarter, we will consolidate our capital return efforts to focus on share repurchases and expect to continue with that approach as long as buybacks make sense from a market, trading price, and valuation perspective.

Cash from operations was $157 million and capital expenditures were $55 million for the quarter. They paid $7 million of dividends and bought back $102 million of stock during the quarter, for a shareholder yield of 14.5% (annualized) on the current market capitalization.

Warrior
The market capitalization of Warrior Met Coal (HCC) is $2.6 billion, up 24% from when we wrote about them last quarter. Their net current assets (ignoring deferred income taxes) are $705 million, so the enterprise value is $1.88 billion.

For the third quarter of 2023 (release, 10-Q), Warrior's adjusted EBITDA was $146 million, up from $130 million in the second quarter. That puts the EV/EBITDA at 3.2x using this quarter or 2.6x using the last nine months' results (annualized).

They sold 2.3 million tons versus 1.8 million in the second quarter. The average price fell from $208/t to $185/t but the cash cost declined from $129/t to $114/t. Cash from operations was $139 million and they spent $112 million on capital expenditures. Very little free cash flow or shareholder returns right now because they are spending it on their Blue Creek project [pdf].

It is a mystery why they are expanding capacity when the met coal price is already showing. Why not just return cash to shareholders? They could also invest in Natural Resource Partners units! In fact, it is kind of comical to be spending money expanding production instead of buying NRP or their own stock.

Maybe Blue Creek will turn out to be a smart investment, if the coal price holds up for the next decade, but the market is already saying (through the royalty owners' and producers' valuations) that it does not believe that the met coal price will hold up for even a couple years.

U.S. Steel
The market capitalization of U.S. Steel (X) is $7.6 billion, up from $5.5 billion when we wrote about them last quarter. The reason for the substantial increase is that in August, U.S. Steel received an unsolicited bid of $35 per share (cash and stock) from competitor Cleveland-Cliffs Inc. Their total liabilities (excluding deferred income taxes) less current assets are $1.2 billion, so we would put the enterprise value at $8.8 billion. 

For the third quarter of 2023 (release, 10-Q), adjusted EBITDA was $578 million, udown from $804 million in the prior quarter. That puts the EV/EBITDA at 3.8x using this quarter or 3.6x using the last nine months' results (annualized). 

For the current year-to-date, the company has generated cash from operations of $1.7 billion but has spent $1.9 billion on capital expenditures. They have borrowed $172 million, repurchased $175 million of stock, and drawn down cash by $280 million.

As we mentioned last quarter, it does not seem great to spend more than 100% of cash from operations on capital expenditures when your company is valued at less than 4x EBITDA and your market capitalization is two-thirds of book value. Those are strong signals from the market not to be investing in capacity.

One interesting commonality to notice is that whether you look at U.S. Steel or Enterprise Products Partners, they are telling us - claiming - that the current investment cycles are not going to last forever. This is from the U.S. steel conference call:

We've been climbing a mountain of strategic CapEx. And now that we're coming down the other side of the mountain, we're not surprised so many see it won't be long before these new world-class assets generate strong free cash flow.

Another interesting comment was about the "tailwinds for American steel":

I mentioned the 3 global megatrends that will provide tailwinds for American steel and our business in the months and years to come. One is accelerating deglobalization. In a world impacted by conflicts like those in the Middle East and Ukraine and emerging from a global pandemic that stretched supply chains to the limit, we are witnessing a stark reversal after decades of globalization. The upshot enabled by legislation like the Bipartisan Infrastructure Law, the CHIPS Act and the Inflation Reduction Act, what we like to call the Manufacturing Renaissance Act. The United States is experienced once in a generation onshoring boom. The deglobalization boom means U.S. Steel's nearly 123-year history of producing steel that is mined, melted and made in the U.S.A. is paying significant dividends, with more to come and significant room for continued growth in North American steel demand. Fundamental to the deglobalization trend is the U.S.A.'s achievement of energy independence. Between our strong segment in tubular steel and our line pipe products coming out of North America and flat-rolled, we are seeing and we will continue to see a robust order book supporting America's energy markets. Another megatrend is decarbonization. There is a strong global commitment to reducing greenhouse gas emissions. With our electrical steels that are empowering the transition to EVs plus our exposure to sustainable steelmaking at Big River, U.S. Steel is well positioned to harness the decarbonization trend.

We are skeptical of big capital expenditures at companies with depressed valuations, but that is our outsider, generalist view. Perhaps our friends at Enterprise Products, Warrior, and U.S. Steel look around and see that no one else is making significant investments in coal, steel, and pipeline capacity. Maybe these investments are a cinch?

Saturday, May 27, 2023

Coal Producer Earnings ($BTU $ARCH $AMR $X)

[We wrote about met coal producer Warrior a couple of weeks ago. Now it is time to take a look at quarterly results for other coal producers Peabody Energy (previously), Arch Resources, and Alpha Metallurgical Resources. Also, note: we are big fans of The Coal Trader for coverage of the coal producer stocks.] 

Peabody Energy
The market capitalization of Peabody is down to $2.8 billion versus $4 billion when we wrote about them in August 2022. Total liabilities less current assets are under $400 million, and current assets now exceed current liabilities plus long term debt. We would put the enterprise value at $3.2 billion now. For the first quarter of 2023 (10-Q), adjusted EBITDA was $391 million, down from $500 million in the fourth quarter. That puts EV/EBITDA at 2x (annualized). 

As of the end of 2022, Peabody had 2.1 billion tons of proven coal reserves and 379 million tons of probable reserves. The proved reserves were comprised of 94 million tons of seaborne thermal coal, 102 million tons of seaborne met coal, 1.7 billion tons of thermal coal in the Powder River Basin, and 155 million tons of other U.S. thermal coal. One calculation that you could make is that the enterprise value is now about $1.30 per ton of proved and probable reserves.

During the first quarter, seaborne thermal sold for $97 per ton with a $51 cost per ton; seaborne met coal for $220 per ton with a $151 cost per ton; PRB coal for $14 per ton with a $12 cost per ton; and other U.S. thermal coal for $55 per ton with a $41 cost per ton. Once again, seaborne thermal coal was the most profitable segment in Q1, earning $164 million of adjusted EBITDA, with seaborne met right behind, earning $91 million in adjusted EBITDA. The U.S. thermal coal (PRB & other) earned $100 million for the quarter.

The seaborne thermal coal is mined in Australia. Seaborne met coal is mined in Australia and Alabama. The PRB coal is, of course, mined in Wyoming, and the other U.S. thermal is mined in Illinois, Indiana, Colorado, and New Mexico.

Peabody reported "Available Free Cash Flow" (AFCF) for the quarter of $262 million. They have said that they plan to return to shareholders at least 65% of AFCF. That would imply a shareholder yield on the current market capitalization of 24% (annualized). Some critics have pointed out that Peabody is a laggard compared with other miners in terms of cost inflation. The Coal Trader says:

"The companies who are able to manage costs will be most capable of maintaining positive operating margins no matter what the fundamental supply/demand situation looks like. These companies will therefore provide superior shareholder returns over time and will begin to separate themselves from their peers. Right now, they all sort of look the same and they’re all sort of valued more or less in the same range, in terms of EV/FCF metrics. But I think we’re starting to see some clear hints of who can separate themselves from the pack, and it might be easier to simply pick out the laggards and avoid them at all costs."

He puts Peabody in the laggard category, given how its costs per ton jumped dramatically in the first quarter. We agree with his notion that mineral producers with lower costs and lower capex requirements will outperform going forward. (That is why it was so important to look at capex growth versus production growth for our U.S. shale and Canadian oil producers this quarter.) Maybe one thing to mention though is that you get a lot of thermal coal with Peabody: almost 2 billion tons. That is a lot of BTUs and you never know; they might come in handy.

Arch Resources
The market capitalization of Arch is down to $2.1 billion. As of their Q1 2023 earnings report, total liabilities less current assets are around $100 million, putting the enterprise value at $2.2 billion. Their current assets exceed their current liabilities plus long term debt. For the first quarter of 2023 (10-Q), adjusted EBITDA was $277 million, which puts the EV/EBITDA at 2x (annualized). 

Adjusted EBITDA for 2022 was $1.26 billion, which is an EV/EBITDA on the current valuation of 57%. Last year they spent $493 million repaying debt, paid $456 million of dividends, and $157 million on share repurchases. Capital expenditures were $173 million compared to $133 million of depreciation.

For the first quarter, the pace of adjusted EBITDA was obviously a little lower (annualizing to $1.1 billion). For the quarter, they spent $31 million on capex (compared with $35 million of depreciation), repaid $71 million of debt, paid $67 million of dividends, and bought back $21 million of stock.

The Coal Trader points out that Arch did a very good job with lowering their cash cost per ton of met coal production in the first quarter of 2023. He says that Arch and Warrior should be the low cost met coal producers in the U.S. and that Arch is the best buy and hold producer if you do not want to have to think too hard.

Alpha Metallurgical Resources
The market capitalization of Alpha is down to $2 billion. As of their Q1 2023 earnings report, total liabilities less current assets are negative $300 million, putting the enterprise value at only $1.7 billion. For the first quarter of 2023 (10-Q), adjusted EBITDA was $354 million, which puts the EV/EBITDA at 1.2x (annualized).

Adjusted EBITDA for 2022 was $1.7 billion, which is an EV/EBITDA on the current valuation of 100%. Last year, they spent $451 million repaying debt, $13 million of dividends, and $522 million repurchasing stock. Capital expenditures for the year were $164 million compared to $108 million of depreciation.

For the first quarter, the pace of adjusted EBITDA was obviously a little lower (annualizing to $1.4 billion). For the quarter, they spent $74 million on capex (compared with $29 million of depreciation), paid $86 million of dividends, and bought back $145 million of stock. With all the repurchases, the share count is down 18.6% year-over year. Since starting its share buyback program five quarters ago, Alpha has repurchased 23% of total shares outstanding.

They have 323 million tons of met coal reserves, all in West Virginia and Virginia, and they account for around one-fifth of U.S. met coal production. That's an enterprise value of $5.26 per ton of U.S. met coal.

Coal Trader says that he agrees with Alpha's management that it is "criminally undervalued" but that they may not occupy as favorable a position on the cost curve as Warrior and Arch. Last week, he posted a writeup of a site visit to Alpha which is very interesting. He says that the Alpha CEO reads his coal Substack!

U.S. Steel
While obviously not a coal producer, U.S. Steel is one step down, vertically, from the production of metallurgical coal, and we have mentioned them in the past as a possible Cheap Cyclical (see also). In our review of Capital Returns, we mentioned that The Coal Trader had made an interesting comment about the relative capital cycle position of the coal producers versus the steel companies:

"[M]y preference is to maintain a bullish stance on the supply-constrained segment of the supply chain, specifically focusing on metallurgical coal and metallurgical producers. If necessary, I will hedge my position by shorting the oversupplied segment, which includes steel companies. While steel companies typically have strong balance sheets, similar to metallurgical producers, they have been investing heavily in capacity additions in an attempt to lower carbon emissions from basic oxygen furnace (BOF) production towards electric arc furnace (EAF) production, especially in North America and Europe. This is the classic Capital Returns cycle at play and if you haven’t read the book I highly recommend it."

We do not like heavy capital investments! (Unless we are in the position of getting a royalty on gross revenue.) U.S. Steel spent $740 million on capex in Q1 compared with $350 million the prior year quarter. That is quite a heavy lift compared with Q1's reported $200 million net income and $427 million of adjusted EBITDA. There is something quite unsatisfying about spending $2.1 billion over the trailing four quarters on capex while CFO was $2.9 billion and your market capitalization is only $4.9 billion. Not to mention the fact that U.S. Steel is trading for less than half of book value - that is a strong market signal not to be investing.

Tuesday, August 23, 2022

United States Steel Corporation ($X)

One of the best investment strategies we have found is to look for market prices that imply mutually inconsistent outcomes. You could call these types of situations, "markets that aren't talking to each other." 

In October 2020, we wrote about what we would buy instead of Tesla, pointing out that for the same ~$0.45 trillion market capitalization as Tesla, which gave you $25 billion in annual revenue and no profit (in fact, cash burn), you could buy - in their entirety - a group of eight other high quality companies, which had combined sales of about $400 billion (trading for a much more reasonable 1x revenue) and net income of around $30 billion a year.

While Tesla has appreciated since that October 2020 post so have the undervalued companies to which we compared it. More importantly, it was so overvalued that it was possible to buy the undervalued companies and express the bearish Tesla side of the trade via a relatively small position in long term put options, because they had (and still have) a very asymmetric risk-reward payout.

There are other markets that are not talking to each other. Our Canadian oil majors are trading for less than five times earnings because, supposedly, there is going to be an electric vehicle transition that brings us battery electric vehicles powered by "renewable" (wind and solar) energy.

Well if that is true, we are going to need vast quantities of steel, copper, concrete, and other basic materials. Yet when we look, we find that the investors who espouse this transition have not invested in the production of any of those materials, and shares of those companies are going begging at very low valuations. Professional investors seem to have lost the ability to translate a worldview into a portfolio if it involves natural resources.

An example is United States Steel Corporation, with shares that trade for the same price as they did in October 2003, almost two decades ago. No compounding has happened here. The market capitalization of United States Steel is $5.5 billion, compared with a book value of $10.2 billion and a tangible book value of $8.8 billion. Total liabilities exceed current assets by only $500 million as of June 30th - very little financial leverage. The total enterprise value is around $6 billion.

U.S. Steel earned $900 million on $6.3 billion of sales in the second quarter, and has earned $1.8 billion on $11.5 billion of sales year-to-date. (Trading for 1.6x annualized earnings and 54% of book value.) For the first half of the year, free cash flow has been $2.1 billion, which is an annualized FCF/EV yield of something like 70%.) (Note that sheet steel prices have fallen significantly since the first half of the year, though.)

Just for sake of comparison, the electric vehicle scam company Nikola still has a $2.5 billion market cap and revenue of $20 million (not billion). The 16th largest cryptocurrency by market capitalization ("TRON") has a bigger market capitalization than U.S. Steel.

It is particularly interesting to see this undervaluation in an industry besides coal or oil. That means it's not just the "energy transition" or fossil fuel divestment. (In fact, those themes should be bullish for steel demand.) Over the past 15 years, couldn't go wrong buying a "compounder," couldn't go right buying a "cyclical."

Company Background
In 2020 U. S. Steel was the third largest steel producer in the United States and the thirty-eighth largest steel producer in the world. During 2021 they had raw steel production capability of 26.2 million net tons (21.2 million tons in North America and 5.0 million tons in Europe). U. S. Steel has four reportable segments: North American Flat-Rolled, Mini Mill, U. S. Steel Europe (USSE), and Tubular Products.

The Flat-Rolled segment consists of U. S. Steel’s integrated steel plants other U.S. operations involved in the production of slabs, strip mill plates, sheets and tin mill products, as well as all iron ore and coke production facilities in the United States. These operations primarily serve North American customers in the automotive, appliance, construction, container, transportation and service center markets. During 2021, Flat-Rolled had aggregate annual raw steel production capability of 17.0 million tons and production was 9.9 million tons.

The Mini Mill segment consists of U. S. Steel's Big River Steel facility and a new mill under construction in Osceola, Arkansas. It produces hot-rolled, cold-rolled, and coated sheets and electrical steel, serving North American customers in the automotive, appliance, construction, container, transportation, and service center markets. Mini Mill has aggregate annual raw steel production capability of 3.3 million tons at the Big River Steel facility and produced 2.7 million tons in 2021.

The European (USSE) segment consists of U. S. Steel Košice (USSK), U. S. Steel’s integrated steel plant and coke production facilities in Slovakia. It conducts its business mainly in Central and Western Europe and primarily serves customers in the European transportation (including automotive), construction, container, appliance, electrical, service center, conversion and oil, gas and petrochemical markets. USSE produces and sells slabs, strip mill plate, sheet, tin mill products and spiral welded pipe. It has annual raw steel production capability of 5.0 million tons and produced 4.9 million tons in 2021.

The Tubular segment produces and sells seamless and electric resistance welded (ERW) steel casing and tubing (commonly known as OCTG), and standard and line pipe and mechanical tubing, and primarily serves customers in the oil, gas and, petrochemical markets. It has annual raw steel production capability of 900 thousand tons and produced 464 thousand tons in 2021.

The biggest and most profitable segment is flat-rolled, with $6.9 billion of sales year-to-date and $1.3 billion of EBIT. The next most profitable is mini mill, which has earned $550 million on $1.8 billion of sales. The European operation earned $540 million on $2.6 billion of sales. Tubular is high margin but a small contributor to sales and earnings.

Competitors of U.S. Steel include other integrated producers, which use iron ore and coke as the primary raw materials for steel production, electric arc furnace (EAF) producers, which use steel scrap as raw materials, and slab re-rollers, who purchase mostly imported, but some domestic, semi-finished products and convert them into sheet products. The EAF producers typically require lower capital expenditures for construction and operation of facilities and may have lower total employment costs; however, these competitive advantages may be minimized or eliminated by the cost of scrap when scrap prices are high. 

In January 2021, U.S. Steel acquired Big River Steel, which increased their annual raw steel production capability by 3.3 million net tons. In addition, they began construction on a non-grain oriented (NGO) electrical steel line at Big River Steel in August 2021, a $450 million investment. The 200,000 ton NGO electrical steel line is expected to deliver first coil in September 2023 and be available to meet the growing electric vehicle demand expected in North America. In January 2022, they announced Osceola, Arkansas as the site of a new highly sustainable and technologically advanced steel mini mill, which is expected to have 3 million tons per year of EAF steelmaking capability.

Discussion
The average realized price of flat rolled and mini mill steels for U.S. Steel YTD was about $1,350/ton, while the current price of sheet steel is under $800/ton. That level is more like the 1H of 2021 when the average realized price for U.S. Steel's flat-rolled was under $1,000. Segment earnings for 1H 2021 were only $725 million as opposed to $1.3 billion the first half of this year. So, be prepared for Q3 2022 earnings to be lower than recent quarters.

Historically (e.g. past decade) U.S. Steel has not been all that profitable. The market price of X basically implies that this spike in steel prices and company profits will be short lived. (And the spike in steel prices was truly anomalous.) But the question is, how can that be true if we are going to have a renewable energy and electric vehicle transition that requires vast quantities of basic materials?

Further, what if some old economy industries are going to experience durably higher profits because of reductions in capacity? Nobody ever thought that refineries and sawmills were going to sustain these levels of profitability. Crack spreads are now much higher than they used to be. Lumber prices are much higher than they used to be, while sawlog prices have barely changed. The same thing happened with airlines.

Wednesday, January 5, 2022

Cheap Cyclicals and Value vs Growth

The market capitalization of United States Steel Corp (X) is only $7 billion. That's about equal to its tangible book value (see latest 10-Q), which is pretty impressive since it was incorporated by J.P. Morgan in 1901.

I think they are something like 10% of U.S. steel production market share. For the first nine months of 2021, they had $14.7 billion of revenue and $3.1 billion of reported net income. Their capex is actually less than depreciation so free cash flow is meaningful as well. They're using it to pay off debt, pay a larger dividend, and buy back stock.

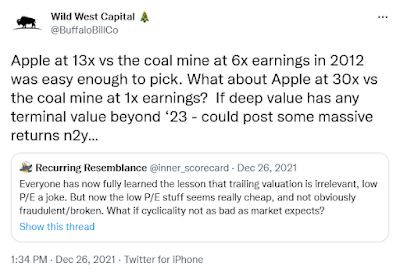
Shares are trading where they were in 2004-2005. That is a pattern common to all of our "cyclical" company investments. The Dorchester Minerals partnership units trade where they did 15 years ago too. So do Suncor shares, British American Tobacco, Pardee Resources, and many other "hard asset" and "resource" type companies. The energy sector ETF (XLE) has been flat (with big swings, of course) for fifteen years.

During the same period of time, the NASDAQ 100 has gone up about tenfold. Over the past 15 years, you couldn't go wrong buying a "compounder," couldn't go right buying a "cyclical".

So now you can buy a steelmaker for 1x tangible book value (historical cost less depreciation) and under 2x earnings. Meanwhile, $7 billion would barely buy you anything in the Ponzi growth part of the market.

  • Beyond Meat has a $4 billion market cap.
  • The EV scam company Nikola still has a $4 billion market cap - with no revenue.
  • The 30th largest cryptocurrency by market capitalization ("Fantom") is the same market cap as U.S. Steel.

A fellow on Twitter has put together something called the "Double Dog Index": it is a basket of companies that are projected to "earn the majority of [their] mkt cap in FCF in next 4-6 quarters," have "a relatively clean capital structure (i.e., not over-levered or w/ debtholder vs stockholder conflicts)," have "reasonable management (i.e., not a stock that 'nobody will touch' due to past mgt transgressions)," are "not publicly opposed to capital return," and are not "special situations". 

His list has coal companies (including ones with significant revenue from metallurgical coal for steelmaking), U.S. Steel and Canadian Steel maker Stelco Holdings, Chilean copper producer Amerigo Resources, nitrogen fertilizer producer CVR Partners, pulp and paper manufacturer Resolute Forest Products, Israeli shipping company ZIM, lumber company GreenFirst Forest Products, and nitrogen fertilizer company LSB Industries. 

It is particularly interesting to see this undervaluation of cyclicals in industries besides coal or oil. That means it is not just the "energy transition" or fossil fuel divestment responsible for the low multiples. In fact, those themes, if they in fact played out, ought to be bullish for steel demand in particular. Here is how the Double Dog author describes the disconnect:

You need to understand that the $ARCH investment setup is available across a wide range of commodity sectors at the moment. Don’t waste your time trying to understand ‘what’s wrong’ or that ‘somebody knows something’ about ARCH. Frankly, a lot of talented commodity equity folks have been blown out in the last decade. We have just come out of a fallow period and there is max macro uncertainty. On top of this, you are messing with the oldest cyclical maxim in the book - you want to pay a high multiple when things look dire, not a low multiple on blowout earnings. There is so much pattern recognition out there that this is how you trade these stocks - and this is another reason why you are seeing this opportunity on your screen.

Yes, macro could be abysmal from here. Yes, there is evergreen idiosyncratic risk in all of these names. But if you truly believe you are generating this amount of cash on a debt free company with somewhat competent management, you just have to bet. What you’re not even considering is that the duration of these high prices could last longer - who knows what could cause the next bottleneck. You are also buying in Year 1 of a bull market after a vicious bear market that restrained investment in many different commodity subsectors. The ‘never pay a low multiple maxim’ was usually a good rubric when we were many years into an upturn. And by the way, Buck, I actually think we might have a real economic recovery in the next 3-5 years, not that pathetic post Financial Crisis drivel that we all struggled through!

What is happening with cheap cyclicals is a perfect example of a redemption flywheel, as described by Lyall Taylor in his two important essays, Market inefficiency, liquidity flywheels and Unravelling value's decade-long underperformance (and imminent resurgence). As I wrote last March,

Lyall’s liquidity and redemption flywheel theory would mean that instead of a bubble making it so that you have to sit on your hands, a bubble causes the tide to go out from investments that are “cold” and we should be looking for those. Based on the theory, they would be investments that had done poorly recently for whatever (possibly idiosyncratic) reasons of their own and suffered a positive feedback loop of selling. His theory implies that the very end of a secular trend in growth vs value would be a crescendo of selling in some areas (that creates the "value") and buying in the other areas (momentum ones, which become very overvalued). And then after the crescendo, the trend would reverse sharply.

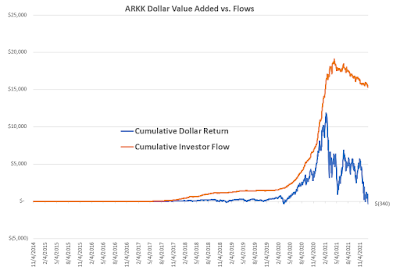
If Lyall's model is correct, it is clear where the value isn't - the stuff that went parabolic at the same time it had big inflows of capital:

And it's also clear where the value is, or should be. The stuff that has been in a bear market for fifteen years; the cyclicals:

I want to wrap this up by emphasizing that, while I used X as an example, X is by no means unique in the commodity space. Near across the board, I’m seeing commodity companies that have been minting cash flow for the past ~6 months but are trading at insanely low valuations / haven’t seen their stocks budge despite the record cash flow. [...]

All I’m trying to point out is that these stocks have not budged after six months of producing record results, and the cash flow to remaining enterprise value dynamics are getting pretty wonky. Each has idiosyncratic risks, but it sure seems like a basket of them will do well absent an [imminent] and deep recession.
There is so much cheap stuff it's hard to pick. We are already full on hydrocarbons (royalties and Canadian oil), pipelines, tobacco, and small financials. But with incremental capital (dividends and new inflows) it seems compelling to diversify into other cheap cyclicals.