Showing posts with label value. Show all posts

Thursday, October 27, 2022

This Earnings Season Vindicates the Value vs Growth Hypothesis

This quarter's earnings season has been vindicating the "value vs growth" hypothesis. The "growth" companies that have long been considered bulletproof and which were valued very expensively are reporting falling earnings, while value companies that are valued less expensively are turning out to have pricing power and are reporting higher earnings.

Growth
Let's go through some examples, starting with the three gigantic growth disappointments, Facebook, Google, and Amazon. These are important because the "FAAG" stocks dominate the indices and have had a tremendous run for more than a decade with consistently rising earnings and rising multiples that crescendoed last year. (Note: the second "A" in FAAG is Apple, which is arguably a value stock, and notably the only one of the four that Buffett has ever owned.)

Wasteland Capital posted a good analysis of the Facebook quarter. Revenue was down 4% in Q3 2022 vs the year ago quarter, but costs and expenses were up 19%. The result was that EBIT fell 46%, operating margin fell from 36% to 20%, and diluted earnings per share got cut in half to $1.64. 

Facebook is now trading for 15x earnings. Does that mean we should dump our Philip Morris and buy META since the multiple is about the same? Well, what if PM is actually the better business? Because the cash flow numbers for Facebook were even worse, thanks to Zuckerberg's huge investment in the "Metaverse" boondoggle. 

Look at the cash flow statement. For the first nine months of this year, Facebook had net income plus depreciation of $25 billion versus $36 billion the prior year. Capital expenditures this year to date have been $24 billion versus $14 billion. Free cash flow has dropped to nothing. As someone on Twitter pointed out, it "just swung from 50% cash flow margins to 0%, in one year, at scale, with strong market position. Are there any examples in history similar?"

What is also interesting is that the company borrowed money, despite not having free cash flow, to buy back stock. This is like looking at an oil company annual report from 2013. Someone else asked, "What if Zuck knows already that Facebook's core, advertisement based business model is ultimately doomed and that the Metaverse is the only chance to survive?"

At Google, again see Wasteland Capital's post. Revenue in the third quarter was up 6% versus the prior year, but costs were up 18%, resulting in an operating margin decrease from 32% to 25%. Earnings per share fell from $1.40 to $1.06 so it is now trading for 22x earnings. One of the big drivers is that the number of employees grew from 150k a year ago to 187k. And again, even worse is what happened to free cash flow. For the quarter, net income plus depreciation was $18 billion versus $22 billion a year ago. Capex went from $6.8 billion to $7.3 billion.

Wasteland Capital's writeup of Amazon's results is brutal: "Bezos’ China-goods flea-market delivered a steaming pile..." Operating income for the quarter was cut in half from the prior year. North America went from a small profit to a loss. Operating cash flow decreased 27% to $39.7 billion for the trailing twelve months, compared with $54.7 billion for the trailing twelve months ended September 30, 2021. Our preferred metric "Free cash flow less equipment finance leases and principal repayments of all other finance leases and financing obligations" decreased to an outflow of $21.5 billion for the trailing twelve months, compared with an outflow of $3.9 billion for the trailing twelve months ended September 30, 2021.

Investors in growth stocks were double counting - the companies were over-earning and these earnings were being capitalized at high multiples. Now that they are past peak cycle, the earnings are falling and they are being re-rated, and the shares are plunging. The NASDAQ is down 31% year-to-date. (Interestingly, the equal weight S&P 500 is down 14% YTD and SPY is down 19%.)

So those are the big three "growth" examples. We have to put that in quotes now because their earnings are declining. They still have a combined $2.6 trillion market capitalization (down from $5 trillion at the peak!) and collectively they do not generate much cash (thanks to Amazon's cash burn and Facebook's "Metaverse" bet). 

Someday, the ex-growth companies expenses will be slashed, their earnings will bottom, and by then they will undoubtedly trade at cheap multiples. But that may take a long time since Facebook and Google are dual share class corporate governance disasters. And the knock-on effects of those SG&A cuts will ripple far and wide - any prospective investment should be evaluated for such exposure. (It would be interesting to compare what percentage of tech employees use nicotine versus energy sector employees.)

Value
Now that we have surveyed some of the growth wreckage, let us turn to the value results. As we mentioned, these companies are turning out to have pricing power and are reporting higher earnings thanks to various combinations of price increases and higher sales volumes.

Back in August the Biden administration claimed that this summer's refined fuel demand was lower than it had been in July 2020. (When fuel prices spiked in June, the EIA did not publish their data for two weeks because of a "voltage irregularity," then claimed that demand had fallen to below pandemic levels.) We knew that the data was wrong because midstream companies and refiners, like Magellan and Valero, were contradicting it in their Q2 results. Oil was below $100 per barrel for almost all of the third quarter, so it is interesting to see what third quarter reports are saying about demand. From the Valero conference call for Q3:

Q: "When you talk about demand surpassing 2019 levels for gasoline and diesel, is that primarily driven by strengthening your export channels? Is domestic demand in your areas of service equally strong?"

A: "Really, it's the domestic markets and our wholesale volumes have trended considerably higher. We set a wholesale volume record in August. We beat that in September, and we're on pace to beat it again in October. So wholesale volumes continue to trend higher. If you look at the pump market through our wholesale channels of trade, gasoline is trending about 8% above where we were pre-pandemic levels. Diesel volumes are trending about 32% above where we were pre-pandemic levels. So seeing really strong domestic demand through our wholesale channels of trade."

Q: "you talked about bulletproofing your balance sheet in the prior quarter, and you mentioned evaluating further reductions in your prepared remarks. How much lower would you like to get on your leverage"

A: "on the cash side, we're at a $4 billion cash balance, we talked about how, going forward, we like to hold more cash at $3 billion to $4 billion probably on the base level. But if you're looking at potentially higher flat price levels or economic downturn, you maybe want to hold a little bit more. So we bias to the upper end of that. So we're close to a good spot on both of those. On a long-term debt to cap -- net debt to cap, we have a 20% to 30% range that we target. We're at 24.5% now at the end of the third quarter, down from 40% at the highest point toward COVID. So we've been working in the right direction. I'd like to be even lower, you'd like to be at the 20% range [of debt to capital] to give you more financial flexibility going forward"

Q: "a part of that meeting [with the White House] was meant to see if there was any possibility if somebody could start a refinery up and we discuss -- the industry discuss the difficulty in doing that and that was really the main coming ones."

A: "there was consideration for the ability to restart refining capacity that had been shut down. And I think the general sentiment was that, that wasn't going to happen. Of course, we're not in that boat. But I mean, people had very good reasons for making the decisions that they made, and they weren't in a position to unwind those decisions. So, the solution is going to probably have to come from some waving of regulation or just reduction in demand, which we just haven't seen to-date."

Q: "You brought it up as there is obviously a risk of a slowing economic cycle out there. What level would you think about a typical recession impact in terms of fuel demand, recognizing gasoline is already well below what we would call, kind of, a normal environment. [...] I'm just wondering how you think about the typical magnitude impact of a recession on fuel demand."

A: "I guess as the guys have, kind of, gone back and looked at recessionary period in the past, they see their product demand has hit about two times GDP. So whatever GDP assumption you're going to have, you would take twice that on the impact of fuel demand. And as you mentioned, more of that is going to be diesel, less on gasoline. I think there are some unique situations as we head into next year. One, jet demand hasn't fully recovered. And so you'll have a good increase in jet demand as we would anticipate, and then Chinese oil demand has been down 20%. At some point in time, they will come out of the pandemic, and you would expect to see Chinese demand recover. So the combination of both those things is that we would expect, even with the typical recessionary period, you may see year-over-year global oil demand growth."

Valero reported earnings of $2.8 billion, or $7.19 per share, for Q3 2022, compared to $463 million, or $1.13 per share, for Q3 2021. That's less than 5x earnings on an annualized basis. Valero's net income plus depreciation for the year-to-date has been $10.5 billion. Capital expenditures have been $2 billion. With that remaining free cash flow, they spent $2.4 billion repaying debt, $1.2 billion on dividends, and $2.8 billion on share repurchases. Remember, this is only a $50 billion market capitalization company.

A few observations about the conference call excerpts. Oil and product demand is very strong even at current high fuel prices. Management is still depressed even though they are raking in money - they want to keep paying down debt. And no one sees a way to increase capacity in the industry.

We also see evidence of strong demand at Magellan Midstream, which reported results this morning. Their refined product shipments were flat Q3 2022 vs Q3 2021, but the transportation revenue per barrel shipped was up 8.7%. (And refined product shipments are up 4% year-to-date versus the first nine months of 2021, with the revenue per barrel up 3%.)

On a market cap of $11 billion and an enterprise value of $16 billion, Magellan's guidance is for $1.1 billion of distributable cash flow. So far this year, they have distributed $685 million and made $473 million of unit repurchases. (During the third quarter, they bought back 2.7 million units at an average price of about $50 per unit.) Units outstanding are down 3.5% year-to-date and the dividend yield this year has run about 8%. 

Amazingly, the MMP dividend yield was only 4% at the beginning of 2014 when the ten year bond was yielding 3%. The Magellan equity risk premium over its own 2050 note is now 160 bps, which has come down significantly. Of course, we must remember that inflation will make a big difference to the real returns of the debt holders versus the equity holders.

Altria also reported results this morning. The most important thing was that operating income in the smokeable segment (i.e. cigarettes) was up despite a bad volume decrease:

Net revenues decreased 1.6%, primarily driven by lower shipment volume and higher promotional investments, partially offset by higher pricing. Revenues net of excise taxes increased 0.4%. Reported OCI increased 1.4%, primarily driven by higher pricing, partially offset by lower shipment volume, higher promotional investments, higher costs and 2021 NPM Adjustment Items.

Smokeable income for the quarter went from $2.75 billion to $2.79 billion. Oral tobacco went from $405 to $425 million. Total operating income from $2.95 billion to $3.1 billion (5% increase). We've noticed that Altria has been heavily promoting their on! oral nicotine product, and indeed the volumes were up 68% year-over-year. 

Recall from earlier in this post how much money Facebook, Amazon, and Google are spending on capital expenditures - hundreds of billions of dollars over time. As Devin LaSarre points out regarding Altria, its capital expenditures are only a couple hundred million dollars: "unreal how much money this company makes with so little reinvested."

As we know, Altria owns 10% of AB Inbev (BUD), which also reported today. If you click through, you'll notice the pricing power (we have seen this across various branded consumer staples) - volumes up 3.7% but revenue up 12%.

Results from Suncor Energy are not in yet, but they made an interesting announcement:

Suncor Energy today announced that it has agreed to purchase an additional 21.3% working interest in the Fort Hills Project and associated sales and logistics agreements from Teck Resources Limited, for consideration of $1 billion. Upon closing, Suncor's aggregate share in the project will increase to 75.4%. The acquisition will be funded by cash from asset sale processes currently underway and the company remains on track with its previously articulated capital allocation framework.

They had previously announced that they sold their wind and solar assets to a Canadian utility, and that covers much of the cost of this working interest purchase. The one remaining partner in Fort Hills is a French energy company that thinks oil will be obsolete by 2050. It is a great sign that our management is picking up barrels, and hopefully they will buy out the stupid, politically correct French super-major oil company.

Recall what we wrote in our "New Milestones in the Value vs Growth Trade" post.

Further signs that the value vs growth trade is continuing will be redemptions from growth funds (that beget further selling), reversal of the ESG mandates and divestments of value stocks by institutions, insider selling and share issuances to fund losses at growth companies despite the lower prices, and a ripple effect up the growth quality and maturity ladders as the unprofitable growth companies buy less advertising and other services from even the profitable, mature FANGs ("cascading revenue declines"). 

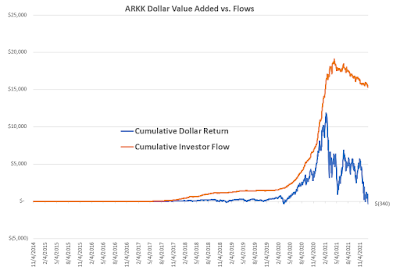
It looks like the Facebook and Google are starting to suffer from the cascading revenue declines. But they must only just be starting, because Amazon Web Services is still holding up. Even Cathie Wood's "ARKK" ETF is still attracting inflows. 

A couple of ways to look at the big cap growth bubble is to chart the performance of the market capitalization weighted S&P 500 (SPY) ETF versus the equal weight S&P 500 (RSP) ETF, or chart the Vanguard IT versus Vanguard Energy.

We are still in the opening innings of the reversal in value versus growth, but today was a big drawdown for growth investors. Do you even hear any of them questioning themselves? From what I can see, they are blaming macro factors and not considering the strategic factor bet.

Thursday, September 1, 2022

Followup on Magellan Midstream and the Equity Risk Premium Strategy

Last year we wrote a post about our "equity risk premium strategy," which referred to a combination of our sector rotation value strategy (looking for companies in industries that have been through an under-investment cycle) and a search for companies with equity yields significantly higher than their debt yields.

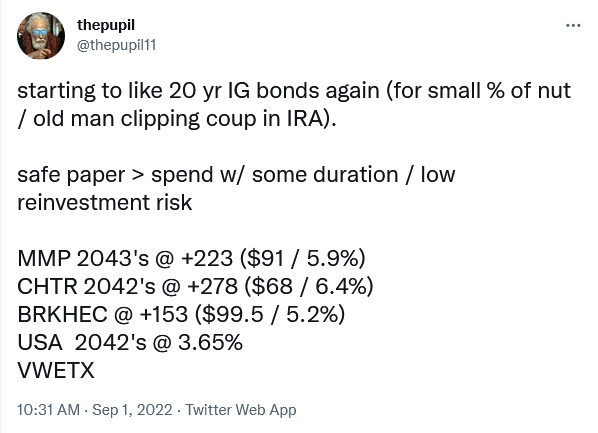
We pointed out that Magellan Midstream Partners, L.P. (MMP) had a 516 basis point spread between its dividend yield and the yield on 2050 maturity. Today, a fellow on Twitter happened to mention a Magellan bond (an earlier maturity, not the 2050) as an investment idea:

We've been asked recently about the advisability of buying CD's (now yielding in the mid 3%-range for a 5 year CD) or investment grade bonds (shown above). 

Before we talk about that, let's go back and look at how Magellan bonds and equity performed since the original ERP strategy post in March of 2021. First, the units:


The unit price is up by about a third, plus there have been six quarterly dividends paid, an additional $6.205, which is a further 16% on original cost. Meanwhile, the bond that we mentioned (the 2050 maturity) has sustained a significant capital loss because of higher interest rates:

The yield on this bond went from 4% to 5.6%, and since it is long duration, the bond fell in price from nearly par to 77 cents, about a 20 percent loss. In the year in a half since the post, that loss has been offset somewhat by 5.9 points of coupon interest income. Still, a 14% mark-to-market decline represents a loss of three-and-a-half years' of coupons.

Something else interesting about this bond price decline is that when we talk about the enterprise value of Magellan, we use the market value of equity (market capitalization) and the face value of the debt. However, we could adjust the enterprise value to use the market value of the debt, too, and as you see on the lengthier maturities it would be quite a haircut. The bondholders' loss is the unitholders' gain.

So, the right trade when MMP bonds were yielding 4% and the units were yielding 9% (the 5% spread mentioned earlier) was to buy the stock and not the bonds. 

What about now? The dividend yield on the units is 8% and the bonds are yielding 5.6%. The spread has been cut in half. Is it time to close out the trade?

We need to account for the fact that Magellan has started returning significant amounts of capital to shareholders via repurchases. The total number of units outstanding was down 5% year-over-year as of June 30th. A quick and easy way to adjust for this is to use their guidance of $1.09 billion of distributable cash flow for the year (which can be used for any combination of buybacks and dividends) that implies a shareholder yield of 10.3%. That is still 470 bps above the cost of debt - the spread has actually not tightened all that much.

Why hasn't it changed, even though the prices of the bond and units moved in directions that should have narrowed it? A key factor: an increase in the earnings per unit of Magellan. As we have emerged from the pandemic, earnings per unit for the trailing twelve months has risen from $4 (for last June) to $4.67 (this June).

This is nothing very profound; it is just why equities have historically outperformed bonds. Inflation is an incredible tailwind to equity investments with pricing power. You just have to avoid being wiped out by a deflationary crash. Is there going to be deflation? While Prechter may still think so, it is a political question. With Pelosi and her husband still daytrading, it is hard to imagine the elites tightening enough to cause a deflationary collapse. The Fed talks a lot about tightening but hasn't done much tightening.

We like ConvexityMaven's theory that the Fed is going to do yield curve control. Instead of letting the bond market crash and taking everything else with it, print money and buy bonds - keep the yields capped. But as the Maven says, in this scenario, "the other side of the balloon gets squishy" - meaning inflation. 

If you look around the world, you will notice tons of countries with fiat currencies are running high inflation rates. Meanwhile, deflationary collapses are rare. Can you imagine the central banks of Brazil, Argentina, or Ghana tightening enough to cause a deflationary collapse? It has never happened, because the path of least resistance is inflation. 

Betting on inflation is the cynical bet. But we have to be cynical enough to realize that the central bank doesn't want us hoarding real assets and is going to try to trick us with jawboning talk. People will believe the talk and there will be violent selloffs. This is why we like "first class" inflation protected assets and not leveraged junk.

If this theory of yield curve control is correct, holders of CD's or investment grade bonds may not lose too much more in nominal terms, since yields will be capped at some level. But they will lose a tremendous amount in real terms due to the inflation. And their loss will be the gain of equity investors in leveraged enterprises with pricing power, like Magellan.

Friday, February 11, 2022

New Milestones in the Value vs Growth Trade: $90 Oil and 2% Ten Year Bond Yield

Our value versus growth trade started in the second half of 2020 when two key ideas clicked together for me. The first happened when I was writing a post, "What I Would Buy Instead of Tesla?", when Tesla had a $460 billion market capitalization:

"[I]nstead of Tesla's $25 billion in annual revenue and no profit (in fact, a cash burn of maybe $5 billion a year), you [could buy a basket of companies with] revenue of about $400 billion (1x revenue, how about that) and net income of maybe $30 billion a year and distributable (as opposed to reinvested) income that's greater than Tesla's revenue."

To put together my shopping list - a hypothetical trade of a business valued at half a trillion with zero or negative free cash flow for a collection of businesses at the same price and tens of billions of dollars of cash flow - I dived into the sectors of the market that had the lowest enterprise value to free cash flow valuation multiples.

The second piece that clicked was reading Lyall Taylor's essays (1, 2) that describe the mechanisms (principal-agent conflict and positive feedback loops) that cause secular cycles in value and growth investing. Instead of a low-agency belief that one example of a bubble anywhere (and there were plenty, of course) meant that everything was a bubble everywhere (i.e. Prechter, Hussman), Lyall had a much more nuanced theory that indicated that a bubble could (perhaps must) coexist with an anti-bubble elsewhere. 

By the end of December 2020, I had realized that there was an opportunity to buy anti-bubble, value stocks (e.g. energy, tobacco, banks, coal, and timber) while simultaneously betting against the Robinhood bubble as a hedge. (A hedge against a Great Depression collapse, anyway. Being long value and short growth actually amplifies day-to-day correlation with the value vs growth trade rather than hedging it.)

Last month we had a third insight. Lyall's 2020 essay had predicted that when a growth cycle ended, the reversal would be violent:

Outperforming in the long term is actually not very difficult, but it requires highly lumpy results, often marked by long periods of lackluster returns punctuated by short periods of spectacular results, which happen alongside liquidity flywheel/momentum reversals, which are inflection points that do not happen very often. Furthermore, usually, the worse value is performing, the closer one is to the end of a liquidity flywheel bubble cycle (value had a woeful time in 1999, for instance), because value is the 'anti-bubble' expression - a Newtonian equal and opposite reaction - of liquidity flywheels driving bubbles elsewhere in markets. It is redemption flywheels that drive value opportunities, and redemption flywheels are often the result of investors pulling money out of unpopular areas of the market in a rush to get exposure to hot areas of markets.

This implies that if you see a major reversal in growth versus value, it needs to be acted on aggressively - pushing one's chips in, so to speak. Earlier this month, we saw that someone helpfully computed this:

Was 2021 the end of an era? Figure 2 shows the rolling 12-month performance of the Long-Term Reversal factor in the US. This compares the returns of the best- and worst-performing stocks of the previous five years, excluding returns to 1-year Momentum, and thus isolating the extent to which longer-term trends are changing. A high reading means that a reversal is underway and previous losers are performing strongly. Conversely, a low reading means that previous trends are continuing.

While we are not yet at all-time highs for the factor, investors have experienced the biggest overall swing in the data set. In the space of a year (highlighted in Figure 2), the dominance once enjoyed by mega-cap tech and Growth stocks has almost entirely reversed, with previous losers approaching the outperformance they enjoyed when the tech bubble burst in 2001.

The problem that growth investors have is that this far into a cycle of growth out-performance, their investments are staggeringly overvalued, and all they had going for them was momentum. Now the momentum is gone.

Meanwhile, the reason people didn't want to own value investments that were fifty cent dollars was because the trades "weren't working". Sure, they had become really cheap, but the share prices had gone nowhere for a decade or more. But now they have momentum and valuation in their favor.

We may have tipped into a new feedback loop - one where value outperforms growth for a secular cycle. For this to be a false alarm, either growth would have to rally to new highs that far exceed their peak levels (since the denominator, value, has risen quite a bit), or value would have to collapse.

Both of those seem dubious given an important fundamental factor: the net issuance anomaly. Growth companies issue torrents of stock, both as a class (with new companies raising money from investors) and individually (from existing companies). Existing growth companies especially like to issue stock as compensation, which makes their reported cash flow numbers look better. As they now have significant share price drawdowns, they are entering an adverse positive feedback loop where they have to issue more stock to maintain existing employee compensation levels. Conversely, as we see when looking at quarterly earnings reports, the energy, tobacco, pipeline, and small banks are all using free cash flow to buy back rather significant amounts of stock.

Further signs that the value vs growth trade is continuing will be redemptions from growth funds (that beget further selling), reversal of the ESG mandates and divestments of value stocks by institutions, insider selling and share issuances to fund losses at growth companies despite the lower prices, and a ripple effect up the growth quality and maturity ladders as the unprofitable growth companies buy less advertising and other services from even the profitable, mature FANGs ("cascading revenue declines"). 

We should think about signs that might confirm that growth has faltered irreversibly. It is certainly a good sign that as the Federal Reserve balance sheet continues to expand at a rock-steady 20% year over year growth rate, the price of crude oil goes up and growth stocks go down. Notice too that the Vanguard IT vs Vanguard Energy ratio has fallen again and retraced almost the entire covid move. It is hard to believe that this is a head fake for value since we have all but completely retraced some of the craziest blowoff moves like Zoom vs Exxon, and Carvana vs Penske.

Another question is: how long do you ride a new secular cycle of value? (Hopefully it's not too presumptuous to be asking that already.) Arguments that the trend is just getting started: there have been no shutdowns or liquidations of growth funds, growth investors, VC-backers of unprofitable companies, or of Ponzi companies. I'm thinking Cathy Wood's ARKK ETF, the RIA Ross Gerber, the VC's who "invested" in cryptocurrency Ponzis, and of course Tesla. Similarly, while there have been some meteoric rises of value investors, they are tiny, tiny fish. Depressed energy investors on Twitter think the rally is overdone because a guy with eight figures under management swung for the fences and tripled it.

You'd get worried if you saw something like Ken Heebner's CGM Focus mutual fund, all-in on natural resources and being called "America's hottest" in the summer of 2008. (At the trough in 2016, the CGM Focus Fund's assets were down 90% from peak in 2008.) Just to look at his June 30, 2008 holdings with $10 billion in the fund is to marvel. When was the last time you saw a mutual fund that was 17% in steel? He had 19% in oil services, 10% in oil refining, 11% in oil E&P, 10% in coal, and 8% in copper miners. Even the people today who believe in the energy transition and think that electric vehicles will take over (and which use 10x as much copper per vehicle) are not making a copper bet like that. Which goes to show that professional investors have lost the ability to translate a worldview into a portfolio if it involves natural resources.

Value investors and especially energy investors still seems skittish. (Again, except for some young guys who are swinging for the fences.) I have been thinking about making a Twitter list called "paper hands" or "NGMI" to keep an eye on their sentiment. There are two guys who are smart, who I like and follow (and they follow me), who are not patiently stacking hydrocarbons because they think some boogeyman (the Fed, the energy sector managements) is going to pull the rug out from under them again. 

Oil had a bear market rally from 2009 through 2014 before collapsing for another six down years. People are scarred by that experience. And the E&P sector managements were and are truly bad because of their principal-agent incentive problems, and we are staying out of that area. But he difference between now and 2014 in hydrocarbons can be seen in the cash flows, capital expenditures, reinvestment percentage, and valuations. 

The following is a compendium of the blog posts, by category, on these subjects since we started thinking on these lines in 2020. Please let us know what you think in the comments.

Conceptual Pieces - secular cycles in value vs growth, plus strategies for finding value

Energy: Oil and Gas - under-investment, implausibility of energy transition, forced ESG divestment

Gold Mining - overlooked because of cryptocurrencies?

Pipelines - implausibility of energy transition, forced ESG divestment

Cryptocurrency - total cryptocurrency supply is infinite at nearly zero marginal cost

Big Tobacco - cheap, with potential earnings growth from "Re-Nicotinization"

Wednesday, January 5, 2022

Cheap Cyclicals and Value vs Growth

The market capitalization of United States Steel Corp (X) is only $7 billion. That's about equal to its tangible book value (see latest 10-Q), which is pretty impressive since it was incorporated by J.P. Morgan in 1901.

I think they are something like 10% of U.S. steel production market share. For the first nine months of 2021, they had $14.7 billion of revenue and $3.1 billion of reported net income. Their capex is actually less than depreciation so free cash flow is meaningful as well. They're using it to pay off debt, pay a larger dividend, and buy back stock.

Shares are trading where they were in 2004-2005. That is a pattern common to all of our "cyclical" company investments. The Dorchester Minerals partnership units trade where they did 15 years ago too. So do Suncor shares, British American Tobacco, Pardee Resources, and many other "hard asset" and "resource" type companies. The energy sector ETF (XLE) has been flat (with big swings, of course) for fifteen years.

During the same period of time, the NASDAQ 100 has gone up about tenfold. Over the past 15 years, you couldn't go wrong buying a "compounder," couldn't go right buying a "cyclical".

So now you can buy a steelmaker for 1x tangible book value (historical cost less depreciation) and under 2x earnings. Meanwhile, $7 billion would barely buy you anything in the Ponzi growth part of the market.

  • Beyond Meat has a $4 billion market cap.
  • The EV scam company Nikola still has a $4 billion market cap - with no revenue.
  • The 30th largest cryptocurrency by market capitalization ("Fantom") is the same market cap as U.S. Steel.

A fellow on Twitter has put together something called the "Double Dog Index": it is a basket of companies that are projected to "earn the majority of [their] mkt cap in FCF in next 4-6 quarters," have "a relatively clean capital structure (i.e., not over-levered or w/ debtholder vs stockholder conflicts)," have "reasonable management (i.e., not a stock that 'nobody will touch' due to past mgt transgressions)," are "not publicly opposed to capital return," and are not "special situations". 

His list has coal companies (including ones with significant revenue from metallurgical coal for steelmaking), U.S. Steel and Canadian Steel maker Stelco Holdings, Chilean copper producer Amerigo Resources, nitrogen fertilizer producer CVR Partners, pulp and paper manufacturer Resolute Forest Products, Israeli shipping company ZIM, lumber company GreenFirst Forest Products, and nitrogen fertilizer company LSB Industries. 

It is particularly interesting to see this undervaluation of cyclicals in industries besides coal or oil. That means it is not just the "energy transition" or fossil fuel divestment responsible for the low multiples. In fact, those themes, if they in fact played out, ought to be bullish for steel demand in particular. Here is how the Double Dog author describes the disconnect:

You need to understand that the $ARCH investment setup is available across a wide range of commodity sectors at the moment. Don’t waste your time trying to understand ‘what’s wrong’ or that ‘somebody knows something’ about ARCH. Frankly, a lot of talented commodity equity folks have been blown out in the last decade. We have just come out of a fallow period and there is max macro uncertainty. On top of this, you are messing with the oldest cyclical maxim in the book - you want to pay a high multiple when things look dire, not a low multiple on blowout earnings. There is so much pattern recognition out there that this is how you trade these stocks - and this is another reason why you are seeing this opportunity on your screen.

Yes, macro could be abysmal from here. Yes, there is evergreen idiosyncratic risk in all of these names. But if you truly believe you are generating this amount of cash on a debt free company with somewhat competent management, you just have to bet. What you’re not even considering is that the duration of these high prices could last longer - who knows what could cause the next bottleneck. You are also buying in Year 1 of a bull market after a vicious bear market that restrained investment in many different commodity subsectors. The ‘never pay a low multiple maxim’ was usually a good rubric when we were many years into an upturn. And by the way, Buck, I actually think we might have a real economic recovery in the next 3-5 years, not that pathetic post Financial Crisis drivel that we all struggled through!

What is happening with cheap cyclicals is a perfect example of a redemption flywheel, as described by Lyall Taylor in his two important essays, Market inefficiency, liquidity flywheels and Unravelling value's decade-long underperformance (and imminent resurgence). As I wrote last March,

Lyall’s liquidity and redemption flywheel theory would mean that instead of a bubble making it so that you have to sit on your hands, a bubble causes the tide to go out from investments that are “cold” and we should be looking for those. Based on the theory, they would be investments that had done poorly recently for whatever (possibly idiosyncratic) reasons of their own and suffered a positive feedback loop of selling. His theory implies that the very end of a secular trend in growth vs value would be a crescendo of selling in some areas (that creates the "value") and buying in the other areas (momentum ones, which become very overvalued). And then after the crescendo, the trend would reverse sharply.

If Lyall's model is correct, it is clear where the value isn't - the stuff that went parabolic at the same time it had big inflows of capital:

And it's also clear where the value is, or should be. The stuff that has been in a bear market for fifteen years; the cyclicals:

I want to wrap this up by emphasizing that, while I used X as an example, X is by no means unique in the commodity space. Near across the board, I’m seeing commodity companies that have been minting cash flow for the past ~6 months but are trading at insanely low valuations / haven’t seen their stocks budge despite the record cash flow. [...]

All I’m trying to point out is that these stocks have not budged after six months of producing record results, and the cash flow to remaining enterprise value dynamics are getting pretty wonky. Each has idiosyncratic risks, but it sure seems like a basket of them will do well absent an [imminent] and deep recession.
There is so much cheap stuff it's hard to pick. We are already full on hydrocarbons (royalties and Canadian oil), pipelines, tobacco, and small financials. But with incremental capital (dividends and new inflows) it seems compelling to diversify into other cheap cyclicals.

Wednesday, March 10, 2021

Value vs Growth Bibliography

Here is a list of the articles that have informed my thinking about value vs growth (see also these posts). 

If you read only one of these links, a very interesting one would be Lyall Taylor's essay about liquidity and redemption"flywheels":

the worse value is performing, the closer one is to the end of a liquidity flywheel bubble cycle (value had a woeful time in 1999, for instance), because value is the 'anti-bubble' expression - a Newtonian equal and opposite reaction - of liquidity flywheels driving bubbles elsewhere in markets. It is redemption flywheels that drive value opportunities, and redemption flywheels are often the result of investors pulling money out of unpopular areas of the market in a rush to get exposure to hot areas of markets

Lyall’s liquidity and redemption flywheel theory would mean that instead of a bubble making it so that you have to sit on your hands, a bubble causes the tide to go out from investments that are “cold” and we should be looking for those. Based on the theory, they would be investments that had done poorly recently for whatever (possibly idiosyncratic) reasons of their own and suffered a positive feedback loop of selling.

His theory implies that the very end of a secular trend in growth vs value would be a crescendo of selling in some areas (that creates the "value") and buying in the other areas (momentum ones, which become very overvalued).

And then after the crescendo, the trend would reverse sharply. 

Is this what we are seeing? Is his theory correct? Here are some example comparisons of "growth" and "value" investments: Russell growth vs value ETFs, NASDAQ vs community banks, Chipotle vs Altria.

Sector Rotation Value Strategy

I've been thinking about how our value vs growth trade has led us to own tobacco, hydrocarbons, pipelines (among other things) and how we might be able to make this a repeatable strategy. I think we are looking for two things:

  • Capital expenditures in the sector are low (at a local minimum, nadir), while at the same time
  • Cash being generated, and returned to investors (dividends, debt reduction, share buybacks) are high relative to enterprise value and market capitalization.

The reason that the first point is important is because investment (or dis-investment) from capacity has predictable effects on profits:

  • Over-investment -> low profits and bad times
  • Low profits and bad times -> under-investment
  • Under-investment -> high profits and good times
  • High profits and good times -> over-investment

Take a look at recent capital expenditure levels in the oil and gas industry. The first chart below is capex in Canadian oil and gas. The second chart shows the combined quarterly capex of four oil majors (XOM, CVX, COP, and EOG) with the individual companies in green and the combined totals in pink.

The combined capital expenditure at the four largest integrated oil companies dropped 80% from peak levels. The last oil price shock (high prices and good times) led to undisciplined capital allocation in the energy industry. That in turn led to low profits, bad times, and bankruptcies. Over the past couple years we have had under-investment. Since the marginal production comes from fast-declining wells, it falls off fast when there is under-investment.


Meanwhile, demand is growing. Even if you doubt it will grow in the U.S., it will grow in the rest of the world.

The stage is set for high profits and good times. Not for nothing, valuations are low in energy. This is important because scarce capital is consistent with under-investment, and low valuations are the second point that we are looking for in this two prong investing approach.

Let's look at a contrasting example. We all know that Costco is a fantastic company. Earnings have been steadily rising the past decade.

The concern is that they may be over-earning - so much of their revenue is from yuppie impulse purchases that are cyclical - and the cycle high earnings are being capitalized at a record high PE multiple. Once you start looking for the double-counting pattern, you see it everywhere.

The industries with the worst trailing 10 year returns (all negative) are: metals and mining, oil, gas & consumable fuels, and energy equipment & services. If this theory is right, there should be mean reversion for them. The rising profits will attract people who will pay higher multiples - double counting.

Meanwhile, the sectors that have been enjoying high profits and good times will have been over-investing. The NASDAQ earnings peak is already in the rear view mirror. As Lyall points out,

Interestingly, earnings have been falling since 2018 and are actually (1) down about 25% from their 2018 peak; and (2) currently slightly below 2016 levels. This is actually not atypical late in a boom/bubble. The flood of capital into an industry usually drives down returns.  Often that's ignored because people are focusing on the growth narrative/top line instead of earnings & returns on capital. Eventually earnings matter though. It goes without saying that the consensus earnings estimates shown in light shade are likely to prove fairly delusional. I think we are most likely to see a continuing downward trend in earnings from here until we have a 2000-style bust & resultant industry capital rationing. If earnings stabilize out at about 150 and the P/E falls to 20x the NASDAQ will fall about 75%. I suspect earnings will probably fare quite a bit worse than that in a legit downturn though. Earnings have already fallen 25% even with extremely favourable top-line conditions. People will argue "but you need to exclude stock comp". The unfortunate reality is that the amount of stock dilution actually significantly increases as share prices fall. You have to issue twice as many shares if the price is 50% lower to give people the same comp package.

Remember that Chipotle spends 60% of revenue on labor and food. Their operating profit margin is just under 5%. As Chipotle's food and ingredient costs rise, they can try to pass it on through higher prices but at a certain point this is limited by hurting sales volumes. Then the margins will just be reduced.

Falling margins at constant revenue will mean falling profits. At that point, the stock could re-rate from 114 times earnings to one-tenth of that multiple. Profound overvaluation can result in some cost inflation causing a 95% share decline in a decent business.

Friday, March 5, 2021

The Chad Value Investor vs The Virgin "Growth" Investor

A correspondent writes in,

The aesthetics of CBS' value rotation trade is sartorial gentlemen smoking cigarettes and driving about their lumber forest land in rugged gas powered 4x4s, all fueled by their lucrative dividend stream while their principal safely compounds in the businesses they own at generationally low prices.

In the cities, teeming masses of buttcoin hodler bugmen fight over dwindling supplies of programming gig jobs and deal with intermittent power outages in their casual hoodie wear.

When the gentlemen are done for the day they return to their 8 children and one loyal wife plus doge. When the bugmen fatigue for the day they visit the local bathhouse and complain to one another about their hopeless plight.

Imagine doing a timber cruise on your logging roads in a manly vehicle like a lifted 4Runner or a Bronco or a Jeep Gladiator. You stop for a smokos break and take a quick measure of merchantable lumber volume. You're a frontiersman, a settler, a pioneer; in the woods in the tradition of great Americans like Teddy Roosevelt and Norman Maclean.

It doesn't matter what the market thinks your timberland is worth because the trees' little solar panels are capturing photovoltaic energy and turning it into product that gets more valuable the longer you wait to sell it. Wood is a Lindy miracle material that has been with us through all the Ages of stone, bronze, iron, and steel. Just as tobacco and even oil are Lindy.

Meanwhile, somewhere a dork's Tesla is catching on fire in his driveway. As he waits on indefinite hold with Tesla Insurance, he checks his Robinhood app and watches his portfolio of unprofitable fad stocks crumble. 

He didn't realize that even the profitable companies (the tech monopolies) were over-earning and trading at high multiples, which made the long thesis an error of double-counting, one that smart resource investors know better than to make. Already, storm clouds were on the horizon; catalysts appearing that would crunch the earnings and the multiples at the same time.

The only thing Lindy about the Tesla dork being short value against growth was that so many had made the same mistake before.

Sunday, February 28, 2021

Value vs Growth Compilation

Just posted a Lyall quote in the comments of the Value vs Growth post:

the worse value is performing, the closer one is to the end of a liquidity flywheel bubble cycle (value had a woeful time in 1999, for instance), because value is the 'anti-bubble' expression - a Newtonian equal and opposite reaction - of liquidity flywheels driving bubbles elsewhere in markets. It is redemption flywheels that drive value opportunities, and redemption flywheels are often the result of investors pulling money out of unpopular areas of the market in a rush to get exposure to hot areas of markets 

I wanted to pull together some of recent posts on value, growth, and covid reopening.

On the value side:

On the growth/bubble side:

Reopening (part of the VvG inflection thesis):

Pondering some other possibilities as growth/bubble hedges to a value portfolio. Tell me what you think of some of these as potential long-term put plays: BYND, NKLA, SPCE, UBER, DASH.

Monday, February 22, 2021

Value vs Growth

The most important investing theme in the world today is the potential reversion to long term trend of value vs growth (VvG).

The covid case numbers are crashing and it appears as though herd immunity (through a combination of vaccines and previous infection) has been reached. The catalyst for the VvG inflection will be the economy reopening combined with shortages stemming from a year of lockdown socialism and the printing of $3.4 trillion in a year. 

The pent up demand for many types of goods and services is so high that we could see a one-time price spike, almost like a currency devaluation, that benefits old-economy goods producing companies and ends the bubble in the Robinhood fad stocks.

I was sitting with the bartenders and managers at my local joint after they closed and for the first time ever they started talking about investments. Some things mentioned: marijuana stocks, BYND, sub-penny stocks, TSLA. All based on momentum. General manager mentioned one of the bartenders made $20k on a sub penny stock and was giving him Apple trading advice. He's at risk for these kinds of employees suddenly quitting when that kind of money falls in their lap.

Another recent anecdote is talking with an early 20s zoomer who is trading Dogecoin on Robinhood. He calls the coins "shares" since the Robinhood UI apparently doesn't distinguish between a crypto coin and an equity share.

These retail folks don't have any self-awareness or irony about what they're doing. It's like how crazy people never think they are crazy; these guys never say "I'm going to put a little money in a momentum strategy and continually rebalance and take profits if it works". If anything, they add capital as the prices go up.

But even though I think the inflection point is here, it does not have to be for value to be a great trade with a cheap hedge. I don't have to call the inflection point or bubble top. I can buy the bottom decile cheap stuff and hedge it with long term put options on the top percentile expensive stuff. 

The reason I think that works is that with record valuation dispersion between value and growth, the top percentile is overvalued by 10-100x. The puts are "expensive" on IV but these represent trillions of dollars of market cap that may vanish in 24 months. Examples: TSLA, ZM, SPCE, NKLA, LI, XPEV, CVNA. Then there are garden variety expensive stocks like CMG, but the IVs on those are cheaper so they could work too.

Meanwhile, the cheap part of the market looks like tobacco (1,2), hydrocarbons, land/timber, pipelines, certain Oddballs, and small banks. All real assets except the banks, but I like the banks as a reopening trade. I think the cheap stuff earns more than enough to pay for the hedge, and I think there's a chance that both legs of the trade perform, where value rallies as the growth bubble pops.

The best writing I have seen on the growth bubble popping is from GMO (linked above) and AQR, which put together a long piece demolishing the idea that value investing is not going to work anymore "because disruption":

Besides just an inherent discomfort with randomness, part of the issue is confusion about why value works at all. It does not depend on getting big events or trends right. It does not depend on having perfect accounting information. Certainly, it does not require a lack of massive technological change over time. No matter what the situation, it simply needs investors to net overreact. Companies that are cheap need to tend to be a bit too cheap for whatever set of facts exists at that time, and expensive companies need to tend to be a bit too expensive. For instance, it’s OK if there’s more monopoly power for a few firms today than before (or any other thing being different this time), as long as humans will still tend to overdo estimates of how powerful and long-lasting those monopolies will be, and vice versa for cheap stocks that lack these advantages.

Some charts that I am watching to measure the growth vs value inflection: Tesla vs Toyota, NASDAQ vs Small Banks, Peloton vs AerCap, Zoom vs Exxon, Carvana vs Penske, and Russell 1000 growth vs value.

Note that R1K value's (IWD) top sectoral holding is 20% financial while the R1K growth's (IWF) top sectoral holding is information technology (45%!). It's Apple vs Berkshire - which is obviously funny since Berkshire has an Apple position.

Monday, December 21, 2020

The Robinhood Bubble

There is a new paper from GMO, "Value: If Not Now, When?" that is a must-read. The key highlights are below:

  • No matter how we define cheap stocks – whether on book, or free cashflow, or forward earnings – they look attractive relative to history. Ten of the eleven definitions of Value presented are cheaper than they’ve been in at least 90% of months since 1971, with the cheap half on price to income the misfit. The relative valuation of this group looks a little bit less compressed at the 13th percentile, but it bears mention that in the cheapest month for U.S. Value of all time – February of 2000 – the cheap half based on this one metric was a similar outlier.
  • Though most definitions of Value look cheap in relative terms, we often hear concerns about this attractiveness being an artifact of the universe within which we are choosing cheap stocks. If we are simply selecting the cheapest securities within the U.S., for instance, we will today be comparing beaten-down energy companies and yield-starved banks with profitable technology behemoths. These two groups should clearly have a significant pricing discrepancy. To address this, we can use industry classification standards to select the cheapest half of companies within each sector, group, or industry, looking at the relative valuations of the cheapest companies in the U.S. when we strip out the “class” bets. No matter what we do, U.S. Value still looks exceptionally cheap (see Exhibit 4).
  • It’s clear that Value is very cheap in relative space, and that cheap portfolios can be formed even when we avoid industries where traditional accounting does a poor job or where monopolies are wiping out the competition. This is not enough to want to invest in Value, however, if we don’t believe that valuations have a reason to rise. In that case, we need to understand whether absent valuation changes – that is, even if Value were to remain as cheap as it is today – we should expect the factor to outperform. It turns out that we should. We can see this by breaking out Value’s relative returns into four pieces: its fundamental undergrowth to the market, its yield advantage (due to being cheap), the profits from selling holdings that have become expensive and replacing them with cheaper securities (what we call “rebalancing”), and changes in relative valuations. Given that valuations cannot trend in either direction forever, it is the first three – growth, yield, and rebalancing – that determine whether Value’s structural prospects are positive or negative. And both before and after 2006, when we put those three together, we see Value outperforming the market (see Exhibit 7).
  • And then 2020 happened. Perhaps it was the lockdown that left people with plenty of time on their hands and no sports to bet on, but this year has seen more crazy activity in the stock market than anything we have seen since 2000. Whether it was Hertz stock rising 10-fold in the spring as a high beta recovery play despite the fact that the company was bankrupt and shareholders wouldn’t have benefitted from a recovery even if it happened, or Kodak stock rising 30-fold after announcing it was going to start making chemicals to enable the production of Covid-19 treatments, very odd and speculative things have been going on. As a more traditionally Growth-y example, Tesla has risen some 800% since the fall of 2019 on the back of 17% growth in vehicles sold. It now has a greater market cap than the sum of all the other U.S. automakers, all the European automakers, and all the Korean automakers, with Honda, Mazda, and Nissan thrown in for good measure. That collection of companies sold approximately 100 times as many cars as Tesla did in 2019. But Tesla isn’t the craziest thing that happened this year, and that is true even if we restrict ourselves to looking only at electric vehicle companies named after Nikola Tesla. This spring a would be Tesla called Nikola went public via a reverse merger with a SPAC at a valuation of $3 billion. In the 2020 EV frenzy, it rose 10-fold to a market cap of about $30 billion. This company is a rare bird in the stock market, a pre-revenue manufacturing company. In fact, Nikola is not only pre-revenue, having never sold any vehicles it has produced, it has also never produced a vehicle. Further, it has not even built the factory in which it aspires to build the trucks that it has yet to sell. This summer, a report came out detailing allegations that almost all of the claims of Nikola’s Elon Musk wannabe founder over the few years of its existence were lies. That founder, Trevor Milton, was forced to resign and the company has yet to meaningfully refute any of the claims made in the report. The stock duly fell, but even after information came out showing that pretty much everything the company has claimed to accomplish in its history was a lie, it still has a market cap more than three times its value at its public debut less than a year ago – a valuation that was presumably predicated on the company’s claims actually being true. With a combination of some the highest valuations ever seen and clear corresponding manic investor behavior, it seems clear to us that Growth stocks are indeed in a bubble.
  • Despite moderately-sized net sector bets and broadly diversified positions across sectors and regions, we were able to build a portfolio with the median long position trading at 1/10th the price/earnings, price/book, and price/sales of the median short, and with almost 6 times the cash flow yield, 5 times the forward earnings yield, and almost 3 times the dividend yield. The median holding on the long side trades at a 58% discount to the average stock on our dividend discount model, and the median short position trades at over a 380% premium. That makes for about a 12:1 ratio, which is very similar to what we saw at the height of the TMT bubble. We are confident the strategy is a reasonable and robust representation of the basic dislocation in equity markets today. It is by no means a low-risk strategy, but we believe its risks are balanced and appropriate in service to profiting handsomely from a recovery in Value, whether that recovery comes in absolute or relative terms.

Take a look through the top 100 Robinhood stocks. In particular, take a look at the following 19 companies trading at exceptionally high multiples of sales despite low profitability:

These 19 companies are trading at a combined value of $1.63 trillion despite having only $74 billion of revenue over the trailing 12 months. That is 22 times trailing sales. (Be sure to read Jesse Felder's piece from a few years ago on the advisability of paying more than 10x sales.)

The combined valuation of $1.55 trillion is equal to about 5% of the S&P 500 companies' value (although most of these 19 are not in the index). It is also equal to 7% of U.S. GDP. Only four of the companies are profitable, earning $1.3 billion, and those trade at a combined market capitalization of $880 billion. 

A funny thing is that some of these compete with each other (TSLA vs the other electric vehicle companies, UBER vs DASH), and the high valuation of any given one of those presupposes that it will win, and have a monopoly on, a winner-take-all market. As a correspondent writes,
I think that last part is the killer. The ZM and DOCU valuations assume that they will somehow kill WORK and/or parts of the incumbent tech giants etc. (WORK is not in your list, but it has a $25 billion valuation versus $834 million in revenue and loses money.)

All the electric vehicle companies will literally kill each other if they don't get killed by the incumbent automakers. The same dynamic would happen in sports betting, plant-based meat.

All of these guys are trading like they will form an oligopoly to own the market, but actually they are just burning each other's houses down while huge incumbents wait to pick at the carcass.

So how did things get this crazy? Lyall Taylor has two good essays on this, Market inefficiency, liquidity flywheels and Unravelling value's decade-long underperformance (and imminent resurgence), that are also must reads. Some highlights from his first essay:

  • A liquidity flywheel is a situation where inflows into an asset class lead to buying pressure that pushes up prices, leading to favourable apparent return and volatility characteristics in the said asset class. This favourable outcome then attracts yet more inflows, leading to yet more buying, etc. Conversely, poorly performing asset classes with significant downside volatility can lead to investor redemptions, leading to forced selling that contributes to yet further price declines, yielding even worse returns and even greater redemptions, and so on. This process can go on for years, and sometimes even for decades, and is a fundamental contributor - perhaps the most important contributor - to both major asset-class bubbles, as well as asset price busts and secular lows that lead to fire sales prices (which are 'anti-bubbles' driven by the same drivers of bubbles in reverse). The disconnect between the ultimate owner of funds and the at-the-coal-face investors actually engaged in individual security analysis is fundamental to this process, because end investors have little to go on other than realised investment returns and volatility, and it introduces both information asymmetries and agency conflicts that can drive radical market inefficiency.
  • A fund manager might have a huge number of very cheap stocks they would love to buy, but if they do not have any available cash, they do not get to 'vote' on the market price by buying in the open market, as they lack the liquidity to do so - in the short term at least (longer term, you can reinvest dividends). Furthermore, if the said manager is suffering investor redemptions due to recent returns being poor, then regardless of the underlying managers' views on the long term attractiveness of individual securities, they will be forced to sell. It is therefore not uncommon for those most informed about the opportunities in undervalued securities to be actually selling them rather than buying, in direct contradiction to the EMH.
  • The opposite is also true for fund managers receiving large inflows - they must buy regardless of their personal views on the valuation appeal of stocks within their purview. It is perfectly possible they believe the stocks to be overvalued and yet still buy them in size, because they have to. Many fund managers are explicitly constrained in how much cash they can hold by their fund charter, but even for those managers that are not so explicitly constrained, if the said manager elects to hold a large amount of cash hoping for a better opportunity to buy, and markets continue to rise, they risk potentially catastrophic levels of underperformance, and so is a luxury they can ill-afford.
  • It is important to understand that market inefficiency is structural and behavioural, not informational. Many investors attempt to invest on the basis that market inefficiency is informational in nature, and dedicate tremendous amount of time and resource to trying to come up with better information than the next guy. However, in today's markets, the primary source of inefficiency is structural/agency driven, and the way to exploit that is not to acquire better information, but to have a structure that allows one to engage in long term value arbitrage that other investors cannot (often taking the form of buying underlying assets that are actually low risk, but are priced as if they were very high risk because they are part of an asset class that is generally perceived to be high risk). This requires a wide and unconstrained mandate (by geography, asset class, etc), long term capital, a rigorously long term approach, and an extreme tolerance for volatility and benchmark variation, which requires patience and emotional fortitude that is sorely lacking in today's instant gratification world.
  • Outperforming in the long term is actually not very difficult, but it requires highly lumpy results, often marked by long periods of lackluster returns, punctuated by short periods of spectacular results, which happen alongside liquidity flywheel/momentum reversals, which are inflection points that do not happen very often. Furthermore, usually, the worse value is performing, the closer one is to the end of a liquidity flywheel bubble cycle (value had a woeful time in 1999, for instance), because value is the 'anti-bubble' expression - a Newtonian equal and opposite reaction - of liquidity flywheels driving bubbles elsewhere in markets. It is redemption flywheels that drive value opportunities, and redemption flywheels are often the result of investors pulling money out of unpopular areas of the market in a rush to get exposure to hot areas of markets.
  • Outperforming in the short term with consistency, by contrast, is extremely hard. The best way to do it is usually a momentum strategy, which works most of the time, but occasionally yields disastrous results on sudden momentum reversals. Momentum is the polar opposite of value - it generates good returns most of the time, and disastrous returns a minority of the time. The latter strategy is a more remunerative strategy for fund managers, however, even if it often leaves long term investors worse off, which is why it is more popular/common. While the good times roll, large performance fees are banked, and it is investors that are left with the losses when it all turns to custard. This is why value investing remains relatively uncommon, despite its long track record of success, and in my view a combination of agency conflicts, information asymmetry, volatility-phobia, and the desire for quick results, will all but ensure market inefficiencies continue, and considerable opportunities for long term value investors will remain for many generations to come.

 And from the second:

  • Contrary to popular belief, there has been no degradation in returns on capital or earnings for value quintiles, which would substantiate the existence of excess 'disruption' in value as compared to historical averages. In fact, value portions of the market have actually done slightly better on these metrics vs. long term averages over the past decade. Asness' analysis concludes that the primary driver of value's underperformance has simply been value getting cheaper and growth getting more expensive, as has been the case in every past cycle where value has underperformed (of which there have been many).
  • Furthermore, it is a major mistake to assume the impact of disruption is confined merely to low multiple stocks (or even felt disproportionately by value). Kodak was a very highly rated, high quality company up until the late 1990s, as was Blockbuster video rentals. That didn't stop them from being disrupted. Indeed, it is actually often the highest quality and highest rated companies that have the most to lose from disruption, as they have both high valuations with very long duration payoffs and very high profitability. This means not only do they have a long way to fall if anything goes wrong (and even the fear of disruption can crush these stocks, whether or not it actually transpires), but their fat margins also act to invite disruption by creating an outsized opportunity for would-be disruptors. One of the reasons Uber exists is that taxis were previously morbidly overpriced, and one of the reasons we have not seen (and are unlikely to see in my view) fintech disruption of the banking industry is that lending spreads are already very thin, and the industry highly capital intensive (onerous regulatory capital requirements) and not especially profitable, so there is little opportunity/reward for doing so.
  • A century of quantitative evidence from market history suggests investors tend to underprice stocks with the most apparently assuredly poor future prospects, and over price those believed to have the most assuredly promising prospects, and underestimate tail risk (both upside and downside), and there is nothing in the past decade's market experience to suggest that has fundamentally changed. Further evidence of this stems from the multiple studies that have been done on net-nets - the worst of the worst in terms of business quality and future outlooks (the outlook is so assuredly bad investors are not even willing to pay a price above net working capital net of all liabilities). As a group, such stocks have substantially outperformed over time. However, very interestingly, when studied have been done where investors were given the opportunity to choose the 'best of a bad bunch', choosing only those that were profitable or paid a dividend for instance, the results were much worse. Taking out the 'worst' of the worst lead to inferior returns. Why? Because if it's obviously bad to you, then it's obviously bad to everyone else as well, and the stock will be priced accordingly, with the probability of unexpectedly favourable change underestimated, leading to greater scope for a major re-appraisal of its prospects if conditions do unexpectedly improve. And occasionally, that happens. Most of the time it doesn't, but sometimes it does, and occasionally you end up with an Apple (which was a net net circa 2000).
  • What all of these cycles have in common is that the initial bout of outperformance was fundamentally justified by emerging secular trends and reasonable starting-point valuations, but subsequently, as a liquidity flywheel was set in motion that drove rapid multiple expansion over many years, the trend ended up being carried to morbid excess. What happens is that fund managers that due to good luck or good foresight owned those secular winners early report great numbers, and great numbers attract inflows. Those inflows are then invested in the same names, pushing share prices higher still. Investors' greed and get-rich-quick instincts are piqued by strong and consistent performance, and particularly when buttressed by an exciting thematic narrative that seems to justify the strong gains and promise more to come, and with results appearing to validate that assessment. More sector-based funds are birthed and promoted to cash in on this growing investor enthusiasm, and as more and more money flows in, prices get pushed ever higher, further validating the narrative, emboldening investors, and dulling risk aversion
  • As a liquidity driven boom roles on year after year, investors become increasingly skeptical about the role of valuation, for the simple reason that valuation has proven to be a poor predictor of share prices in recent history. Stocks that looked expensive just kept going up (due to liquidity, which is why they were expensive in the first place), so investors - many of which lack decades of experience - come to believe that focusing too much on valuation is a bad idea. Investors will also point to a handful of big secular winners like CSCO and MSFT (in the 1990s) and AMZN this cycle and note they were 'always expensive' and that it was a mistake to pass them up simply because they didn't trade on low multiples. They will then use this logic to justify paying almost any price for companies of vastly inferior quality, ignoring how unique and uncommon companies like AMZN are, so long as stock prices keep going up and validate the narrative. They are right that valuation is not a good predictor of share prices, but are wrong about why. They think it is because it is growth and business quality driving returns, when in fact it is simply liquidity. Nifty-50 investors learned this the hard way when the same high quality businesses with the same high quality and defensive operating results they had always had fell 80% in the 1970s.
  • Zoom Communication's peak market capitalisation was recently about US$200bn. Even to trade on a relatively high 20x earnings, it would need to earn US$10bn after tax. Are investors aware of how few companies there are in the world that actually make US$10bn? It's about as much money as Coca-Cola and Visa make, for instance - two of the world's finest enterprises. Very few companies make more than US$10bn, because that is a lot of money, and the world is not infinitely big. 
  • Peter Lynch observed that it's always incredibly dangerous in markets when investors say company Y will be 'the next X'. In his experience, Y almost always blew up, and in my view that is because outsized success requires a unique and unlikely alignment of stars that occurs infrequently, and is also often the result of a lack of competition leading to an early advantage. The dot.com bust for instance may have helped Amazon a lot by cutting off access to capital to new emergent competition for many years, giving it time to solidify its lead. That doesn't happen in an environment where a million startups are getting funded and VCs are throwing billions of dollars at anything with a large TAM. When you have half a dozon companies all throwing billions of dollars at becoming the 'Amazon of South East Asia', a far more likely outcome is that they all fail and simply end up incinerating cash battling it out amongst each other for market share, just like the ill-disciplined airline industry of old.
  • At the late/extreme stages of a cycle, it can often reach the point where investors liquidate other assets wholesale in order to increase participation in the boom. This is usually the point in the cycle where multiple dispersion really starts to accelerate, and value funds not only lag from a relative perspective, but also begin to report poor absolute returns as well, as redemptions force sales and drive down prices.
  • The other thing that happened was that the stock market worked in fulfilling its capital intermediation role. If there is insatiable appetite for anything tech which drives valuations higher and higher, the financial industry will manufacture more product to sate that demand, which included a flood of tech IPOs. Eventually there was so much new IPO product it was able to absorb and overwhelm the wave of buying liquidity. We are seeing the same thing today. In the past on this blog, I talked about how there was a VC bubble unmatched by the stock market, and this was why we were seeing so few tech IPOs - the valuations would not stand up to the scrutiny of public markets. That has now changed - the IPO/listed space has become as/more frenzied than the VC space, and this has led to a flood of tech IPOs. As more and more IPOs come to market, not only is more capital raised to fund yet more product development and hence more competition, but there is simply are greater supply of stock to sate speculative demand. Secondary issuances, and continuing copious SBC (stock based compensation) and insider selling serve to further continuously increase supply. At some point, the force of supply will start to overwhelm demand, and that happened in 2000. And it led reflexively to an escalating cyclical downturn as tighter access to funding slowed IT spend, which had cascading impacts through the supply chain.

So what should we do? Well, I have been waiting for this for a long time. I have been mostly in cash with small allocations to Tesla puts and cheap micro caps. (And it has been painful on both ends, even holding mostly cash). 

But we are getting the onslaught of supply that Lyall talks about in his last point. In the past two days, there have been 20 more SPACs announced. The people running these companies are sharks, not dreamers, and so are their VC backers. You can bet they are going to feed the ducks while they are quacking. So NIO sold stock last week, Tesla sells stock hand over fist, and then we have insiders selling. The promoter who took SPCE (Virgin Galactic) public through a SPAC last year just dumped a big chunk of his holdings. 

I think the opportunity is to buy anti-bubble, value stocks (energy, tobacco, banks, coal, and timber are some cheap sectors) while simultaneously betting against the Robinhood bubble. I think that most of the 19 stocks that I posted above are worthless and a handful are maybe worth 0.1x the valuations they currently trade. That makes it a $1.5 trillion short opportunity, as big as the housing bubble shorts (including the mortgages) were when I started this blog

We know that we can't short them, because criminals and the innumerate can squeeze them to arbitrarily high levels before they collapse. The logical conclusion would be the same one that we came to in 2007-2008: long term put options. 

I have started to play with the risk/reward numbers on the Robinhood Bubble 19. It is actually hard to beat Tesla as a put option candidate - with NKLA for example, you have a more certain downside but more expensive options. 

Take this example: if Tesla traded at the same $35 billion market capitalization as Ford (which would be more than 1x sales), it would have a $40 share price. You can buy a January 2023 $50/$40 put spread on TSLA for a debit of less than 75 cents. In other words, pricing in a 7.5% chance that it would trade at the same valuation as an automaker with 4x as much revenue.